|
One of the base units of analysis for biogeography and conservation science is the species range map. Once we know where a species is, we can ask questions like "Why is it there?", "How did it get there?", or "What can we do to make this place better for it?" Especially these days, I am very interested in mapping marine fish distributions, which, it turns out, is not as simple as mapping terrestrial species. The problem is that ecological niche modeling and species distribution modeling methods and theory were largely developed by people working in terrestrial systems. Specifically, correlative modeling approaches were developed based on environmental conditions extracted at two-dimensional coordinates across a horizontal landscape. Sure, birds and insects fly (and some of them at very high altitudes), but their interactions with the upper troposphere are generally brief and unlikely to directly effect the distributions of these species. In comparison, ocean fishes may live their whole lives at the ocean's surface or the seafloor, but they may also swim freely somewhere between the two. The largest migration in the world occurs DAILY, when a million tons of mesopelagic fishes travel between the cold, dark safety of the deep sea and warm, food-rich surface waters. If you modeled the ecological niche of one of these pelagic species based on surface conditions where it was caught at night, you might drastically underestimate its temperature tolerances. If distribution maps based on these inaccurate models are used in downstream analyses, they may bias results and cause all kinds of other problems. This is where voluModel comes in. voluModel is an R package I developed in collaboration with my advisor and co-author, Carsten Rahbek, during my Marie Curie Fellowship postdoc. In our new paper, out in Methods in Ecology and Evolution this week, we introduce a workflow to extract environmental conditions based on the three-dimensional coordinates where fishes are observed, as well as their background environments. These data can then be used in any typical ecological niche modeling algorithm that accepts data in a points-with-data format; the model can then be projected back into three-dimensional space using a simple loop. While three-dimensional modeling has been done before, this is the first set of tools to efficiently move through a 3-D workflow instead of using case-specific custom code. Accompanying the package are vignettes that provide 1) an overview of how voluModel works, 2) raster processing tools, 3) 3D environmental data sampling, 4) visualization tools, and 5) a basic overview of how to generate a generalized linear model with 3D data. Development of voluModel is ongoing--there have been three major updates since we first submitted the paper. Largely, this is due to the rapidly-developing landscape of faster, more efficient geoprocessing R tools using terra and other successors to the raster and rgeos packages, which are being phased out. However, we have also implemented several suggestions from manuscript reviewers and early package adopters. If you have suggestions for improvements or missing features, or if you have found bugs, you may report them here, or even better, send me a (detailed) pull request! My aspiration is that voluModel helps niche modelers (including me) to efficiently generate more accurate estimates of pelagic species distributions for downstream biogeographic analyses and conservation assessments. This is especially useful for data-poor species that may not be subject to the same exhaustive study as target fisheries species, but which are nonetheless important pieces in the puzzle both for biogeographers and conservation scientists. Read our new paper in Methods in Ecology and Evolution HERE. Access the voluModel website HERE. View voluModel on CRAN HERE. 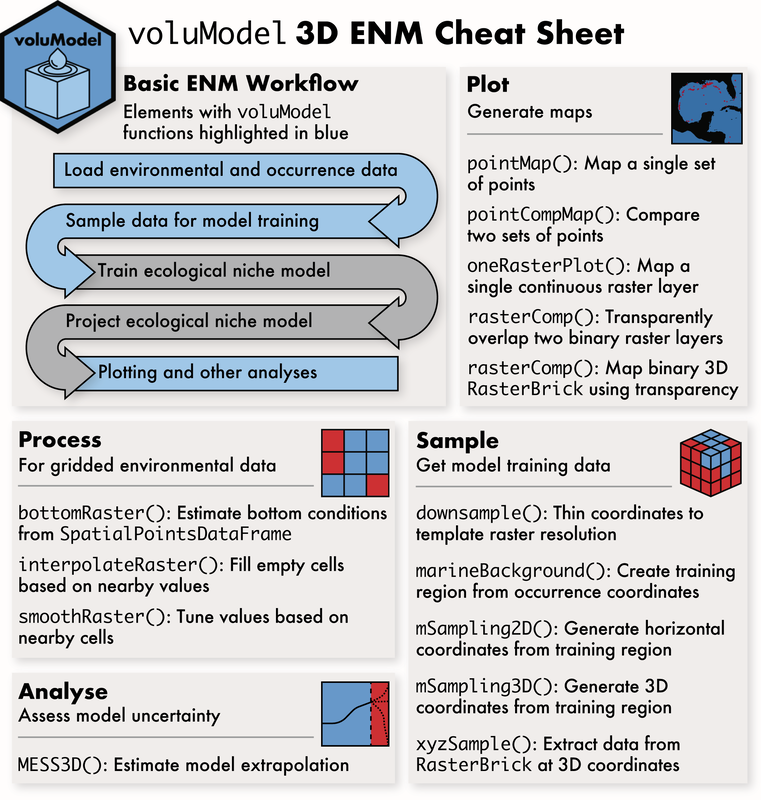 I’m thrilled to have been part of a paper out in Ecography today: “wallace 2: a shiny app for modeling species niches and distributions redesigned to facilitate expansion via module contributions”. It updates the original wallace R package, which is a really useful tool for teaching niche modeling in the R ecosystem without requiring students to be exceptionally proficient at coding first. All a person needs do is execute two lines of code, and a graphical user interface pops up that walks them through the steps of a niche modeling analysis, while documenting the decisions made along the way in R code file that can re-run to repeat the analyses.
There is a lot of potential for this approach to be used to teach students the workflows and methods involved in fairly complex niche modeling analyses. I have incorporated it into teaching materials for Masters' and PhD level courses, as well as non-academic workshops, and the new features really expand the scope of applications one can cover. wallace 2.0 also makes it easier to add custom modules to the wallace workflow (essentially analysis options, like specific statistics or data sources), and adds several such modules (including my occCite occurrence citation package). Here's the package website, which includes links to tutorials in multiple languages, including English, Spanish, and Japanese: wallaceecomod.github.io Here’s the citation: Kass, J.M., Pinilla-Buitrago, G.E., Paz, A., Johnson, B.A., Grisales-Betancur, V., Meenan, S.I., Attali, D., Broennimann, O., Galante, P.J., Maitner, B.S., Owens, H.L., Varela, S., Aiello-Lammens, M.E., Merow, C., Blair, M.E. and Anderson, R.P. (2023), wallace 2: a shiny app for modeling species niches and distributions redesigned to facilitate expansion via module contributions. Ecography e06547. https://doi.org/10.1111/ecog.06547 |
AuthorBiodiversity. Biogeography. Archives
October 2023
Categories
All
|
| Hannah L. Owens | What's Going On? |
 RSS Feed
Universitetsparken 15, byg 3
2100 Copenhagen Ø, Denmark
hannah.owens(at)SUND.ku.dk
Copyright © 2015