|
One of the base units of analysis for biogeography and conservation science is the species range map. Once we know where a species is, we can ask questions like "Why is it there?", "How did it get there?", or "What can we do to make this place better for it?" Especially these days, I am very interested in mapping marine fish distributions, which, it turns out, is not as simple as mapping terrestrial species. The problem is that ecological niche modeling and species distribution modeling methods and theory were largely developed by people working in terrestrial systems. Specifically, correlative modeling approaches were developed based on environmental conditions extracted at two-dimensional coordinates across a horizontal landscape. Sure, birds and insects fly (and some of them at very high altitudes), but their interactions with the upper troposphere are generally brief and unlikely to directly effect the distributions of these species. In comparison, ocean fishes may live their whole lives at the ocean's surface or the seafloor, but they may also swim freely somewhere between the two. The largest migration in the world occurs DAILY, when a million tons of mesopelagic fishes travel between the cold, dark safety of the deep sea and warm, food-rich surface waters. If you modeled the ecological niche of one of these pelagic species based on surface conditions where it was caught at night, you might drastically underestimate its temperature tolerances. If distribution maps based on these inaccurate models are used in downstream analyses, they may bias results and cause all kinds of other problems. This is where voluModel comes in. voluModel is an R package I developed in collaboration with my advisor and co-author, Carsten Rahbek, during my Marie Curie Fellowship postdoc. In our new paper, out in Methods in Ecology and Evolution this week, we introduce a workflow to extract environmental conditions based on the three-dimensional coordinates where fishes are observed, as well as their background environments. These data can then be used in any typical ecological niche modeling algorithm that accepts data in a points-with-data format; the model can then be projected back into three-dimensional space using a simple loop. While three-dimensional modeling has been done before, this is the first set of tools to efficiently move through a 3-D workflow instead of using case-specific custom code. Accompanying the package are vignettes that provide 1) an overview of how voluModel works, 2) raster processing tools, 3) 3D environmental data sampling, 4) visualization tools, and 5) a basic overview of how to generate a generalized linear model with 3D data. Development of voluModel is ongoing--there have been three major updates since we first submitted the paper. Largely, this is due to the rapidly-developing landscape of faster, more efficient geoprocessing R tools using terra and other successors to the raster and rgeos packages, which are being phased out. However, we have also implemented several suggestions from manuscript reviewers and early package adopters. If you have suggestions for improvements or missing features, or if you have found bugs, you may report them here, or even better, send me a (detailed) pull request! My aspiration is that voluModel helps niche modelers (including me) to efficiently generate more accurate estimates of pelagic species distributions for downstream biogeographic analyses and conservation assessments. This is especially useful for data-poor species that may not be subject to the same exhaustive study as target fisheries species, but which are nonetheless important pieces in the puzzle both for biogeographers and conservation scientists. Read our new paper in Methods in Ecology and Evolution HERE. Access the voluModel website HERE. View voluModel on CRAN HERE. 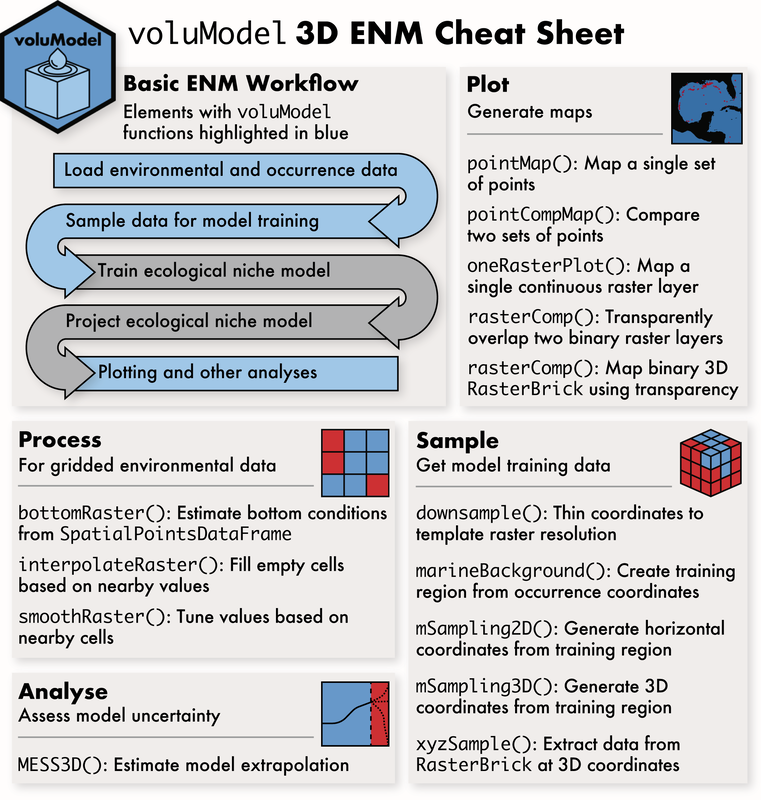 Recently, I got the very exciting news that a project I've been leading was awarded second place in the Ebbe Nielsen Challenge, an annual contest put on by the Global Biodiversity Information Facility (GBIF). The idea behind the challenge is to recognize projects that use GBIF-supplied biodiversity data and tools to innovate and promote open science. The project I and my colleagues (Cory Merow of the University of Connecticut, Brian Maitner of the University of Arizona, and Vijay Barve & Rob Guralnick of the Florida Museum of Natural History) submitted is an R package called occCite. OccCite helps track where species occurrence data comes from. When we are trying to understand why species are found in a particular place, we often download our data from aggregators like the Global Biodiversity Information Facility. GBIF is a meta-database that serves data from over a thousand other sources, from museums like the Florida Museum to community science initiatives like eBird and iNaturalist. Often, the datasets we download contain data from multiple primary sources, and it can take a long time to track down a good citation for each source. OccCite looks at the raw data we've downloaded, and generates summaries of data sources, including formatted citations for inclusion in research papers. Citing primary data providers is important not just so that the research we do is reproducible, but also so primary providers like museums can keep track of how the data they provide is being used. Museums can then use this information to demonstrate how relevant their collections are for ongoing research. I came up with the idea for OccCite after spending the better part of a week creating tables and collecting appropriate citations for a paper I wrote on mapping butterfly diversity that used occurrence data from 37 papers, four community science websites, directly from three natural history museums, four aggregator databases (like GBIF), a colleague's personal collection, and Flickr. Through occCite, you can download all known records from hundreds of museums and community scientists. That data will come not just with where they were found and when, but also comes with tables showing how many records came from each source, as well as pre-formatted citations for that data. If you are interested in learning more about how to use occCite, I made a video tutorial (because after attending a recent workshop on how to make videos, it seems much less daunting). Here it is: Last summer, Rob Guralnick, my postdoc advisor at the time, challenged me to come up with a way of estimating climate stability from a series of rasters representing climate change through time (such as one might obtain from WorldClim or PaleoView). We were discussing this because we had a collaborator that was interested in the role climate stability might have played in generating observed geographic patterns of biodiversity in the Neotropics. Less than a year later, the paper's out, and so is an R package that provides the climate stability estimates I generated, as well as tools for you to generate your own climate stability estimates!
The paper can be found here: https://doi.org/10.17161/bi.v14i0.9786 The package is on CRAN: cran.r-project.org/package=climateStability And here is a small vignette explaining how it works: climatestability_vignette.html |
AuthorBiodiversity. Biogeography. Archives
October 2023
Categories
All
|
| Hannah L. Owens | What's Going On? |
 RSS Feed
Universitetsparken 15, byg 3
2100 Copenhagen Ø, Denmark
hannah.owens(at)SUND.ku.dk
Copyright © 2015