|
As avid followers of my website (if such folks exist) may have noted, I have moved from the University of Florida to the University of Copenhagen, but I am still hard at work trying to understand biogeographic and evolutionary patterns using large, natural-history-collection-centric data. However, I took a break from R this week to attend a workshop by Julia Heinen, a PhD student here at the Center for Macroecology, Evolution, and Climate, on how to communicate science through video. It had been a while since I had given it a try, and it's pretty darn impressive what you can do with a cell phone and iMovie in an afternoon these days. I present to you the result: As WeDigBio rapidly approaches, we have one last batch of Swallowtail butterflies ready for transcription — these from the American Museum of Natural History. By now you (and I) may have seen quite a few of these large, colorful butterflies. Do we really need more?
Yes! I’m working toward understanding variations in wing shape across the full geographic range and diversity of the group. Some museums have particular strengths in certain parts of the world, and more established museums like the American Museum and the Smithsonian (remember that batch from last month?) have specimens that are particularly rare and historic. This is valuable to me because I want to examine specimens from all species of New World Swallowtails, and this trip to the American Museum completed my collection of digital images. I was particularly excited to come across several specimens of the Esperanza Swallowtail, Pterourus esperanza. These were the first I had seen in visits to three other major museums and searching through thousands of specimens. Esperanza Swallowtails are found only in the cloud forests of the Northern Sierra in Oaxaca, Mexico, and weren’t even described until 1975. A 2013 study estimated the population size to be 286 individuals. The precious few specimens at the American Museum can help give us insight into the evolutionary context for this rare and enigmatic species. That understanding can hopefully help better conserve this and other swallowtail species. Keep an eye out for these neat oddities as you transcribe. They’re a treat! --Originally posted on Notes From Nature blog, 17 October, 2017 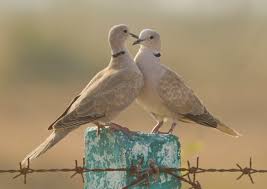 This update was a little slow in coming, but we had a new paper come out recently that highlights some of the benefits of using large citizen science datasets to understand invasion dynamics. Specifically, we looked at the well-documented invasion of Eurasian collared doves in North America following their introduction in Florida in 1989. Our study benefited in large part from collared dove sightings by birders posted to the eBird website, by which we could track new locality records as the species spread. It turns out all that compulsive list-making can really benefit science!
In the paper, we wanted to understand how the rate of invasion of collared doves in North America related to the position of invaded habitats within the suitable abiotic niche of the species. That's a mouthful. Let's step back. Think about it this way. In a given location, there will be an annual mean temperature, annual precipitation, etc. The combination of these variables at this location can be thought of as its position in "niche space" just as its latitude and longitude describe its location in geographic space. In the paper, we inferred the dimensions of abiotic niche space (i.e. temperature, precipitation, etc.) suitable to collared doves based on its known distribution. We then looked at records of the expansion of collared doves as they invaded North America. We then calculated the position of the invasion front in niche space every year to see if doves moved faster in more suitable habitat. This was our hypothesis, since we thought more comfortable habitat would lead to more offspring being produced and consequently more birds to disperse and invade. What we found was actually the opposite! The invasion moved faster through unsuitable habitat. We hope in the future that these methods can be used to explore other well-documented species invasions to see if this pattern is the exception, or a hint at a new paradigm for invasion dynamics. Citation: Ingenloff, K, CM Hensz, T Anamza, V Barve, LP Campbell, JC Cooper, ED Komp, L Jimenez, KV Olson, L Osorio-Olvera, HL Owens, AT Peterson, AM Samy, M Simões, J Soberón. 2017. Predictable invasion dynamics in North American populations of the Eurasian Collared Dove Streptopelia decaocto. Proceedings of the Royal Society B 284: 20171157. doi: 10.1098/rspb.2017.1157 Article link: http://rspb.royalsocietypublishing.org/content/284/1862/20171157 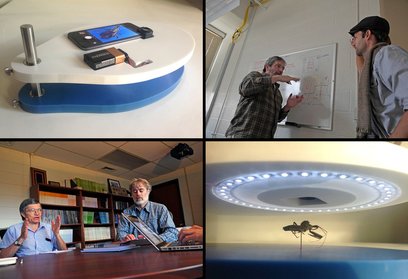 This week we published a new paper, "Automated identification of insect vectors of Chagas disease in Brazil and Mexico: the Virtual Vector Lab", in PeerJ. This is the first of (hopefully) many products to come out of the Virtual Vector Lab project, which started at the University of Kansas when I was in the last year of my PhD program. The aim of the project is to facilitate the identification of potential insect disease vectors to species by public health workers by uniting technology with taxonomic expertise. The project is interdisciplinary, involving biologists, computer scientists, and artists at institutions in the US, Brazil, and Mexico.
My role in the project was to read through the taxonomic literature on triatomine insects (aka assassin bugs, the vectors of Chagas disease) and identify potential morphological landmarks from which we could obtain measurements to identify specimens. I then performed the measurements by hand using digital images of museum specimens and developed a preliminary classification algorithm for identifying the specimens. Based on this preliminary work and in collaboration with an expert on image recognition software, I then optimized the landmarks for identification power and automatability of measurement collection. My collaborators were further able to further improve the ability of our workflow to automatically identify insects by generating a candidate species lists based on distribution maps of all triatomine vectors and the location from which the image was collected (this information is available as a matter of course when an image is taken with a smartphone, all of which have built-in GPS). When all was said and done, we had an automated identification success rate of over 80%. Not bad for a computer! To further improve our success rate in the future, we are working to facilitate the collection of standardized through a 3D printable smartphone stand that will provide a standard background color, lighting, and distance from the subject. It's another exciting day in the life of a museum scientist! Citation: Gurgel-Gonçalves, R., Komp, E., Campbell, L.P., Khalighifar, A., Mellenbruch, J., Mendonça, V.J., Owens, H.L., de la Cruz Felix, K., Peterson, A.T. and Ramsey, J.M., 2017. Automated identification of insect vectors of Chagas disease in Brazil and Mexico: the Virtual Vector Lab. PeerJ, 5, p.e3040. Open access article: https://peerj.com/articles/3040/ |
AuthorBiodiversity. Biogeography. Archives
October 2023
Categories
All
|
| Hannah L. Owens | What's Going On? |
 RSS Feed
Universitetsparken 15, byg 3
2100 Copenhagen Ø, Denmark
hannah.owens(at)SUND.ku.dk
Copyright © 2015